
|

What is the Total UK Public Spending?
For the year ending in March 2026:
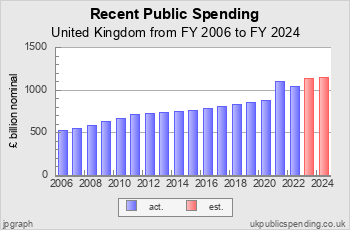
Total UK public spending, including central government and local authorities, is estimated at
£1,323.8 billion.
UK National Spending Analysis
This page shows the current trends in UK national spending. Also see charts on UK spending history.
Recent UK Total Public Spending

Major UK Public Spending Programs

Chart S.04t: Major Spending Programs
UK public spending in 1990 at the end of the premiership of Margaret Thatcher was 30 percent of GDP. Major spending functions were Pensions at 3.58 percent GDP; Health Care at 3.66 percent GDP; Education at 3.68 percent GDP and Welfare at 5.48 percent GDP.
By 2000 UK public spending was up a little at 31.1 percent of GDP. Major spending functions were Pensions, up sharply at 6.00 percent GDP; Health Care at 4.52 percent GDP; Education at 3.90 percent GDP and Welfare at 5.38 percent GDP.
By 2010 UK public spending was up sharply at 43.1 percent of GDP in the aftermath of the global credit crisis. Major spending functions were Pensions, up to 7.45 percent GDP; Health Care up to 6.94 percent GDP; Education up to 5.67 percent GDP and Welfare at 7.09 percent GDP.
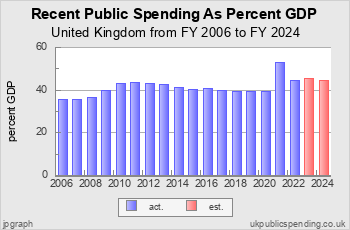
By 2020 UK public spending was down to 39.32 percent of GDP just before COVID. Major spending functions were Pensions, down to 7.15 percent GDP; Health Care up to 7.30 percent GDP; Education down to 4.03 percent GDP and Welfare down to 5.33 percent GDP.
By 2023 after the COVID era UK public spending was up to 45.29 percent of GDP. Major spending functions were Pensions, at 7.10 percent GDP; Health Care up to 8.45 percent GDP; Education at 4.21 percent GDP and Welfare at 5.88 percent GDP.
Spending Data Sources
Expenditure data since 1983 comes from HM Treasury’s Public Expenditure Statistical Analysis reports.
Detailed table of spending data sources here.
Gross Domestic Product data comes from measuringworth.com.
Central government spending data begins in 1692.
Local authority spending data begins in 1868.
Site Search
Data Sources for 2021_2026:
Sources for 2021:
GDP: OBR EFO supp. economy tables
Spending: HM Treasury PESA
Debt: OBR Public Finances Databank
Sources for 2026:
GDP: OBR EFO supp. economy tables
Spending: HM Treasury PESA
Debt: OBR Public Finances Databank
> spending data sources for other years
On July 23, 2025, HM Treasury published its Public Expenditure Statistical Analyses (PESA) for 2025. ukpublicspending.co.uk uses the PESA tables of public spending at the "sub-function" level as its major data source for UK public spending.
ukpublicspending.co.uk has now updated its spending tables using data from PESA 2025. The update includes outturn spending data for 2023-24, and plans data for 2024-25. ukpublicspending.co.uk uses PESA's Table 6.4 for Central Government expenditure, Table 7.4 for Local Authority expenditure, and Table 8.3 for Public Corporation capital expenditure.
Since HM Treasury does not provide plans estimates for future Local Authority spending, ukpublicspending.co.uk provides "guesstimates" instead. This is done by extending the percentage increase in spending between 2023-24 and 2024-25 for each sub-function for the plans year. It is assumed that local authority spending reductions will not carry through to plans years.
Country and Region spending has been updated up to 2023-24. These are obtained from Chapters 9 and 10 in the PESA document.
Quick Links
Get spending chart.
Download spending table.
Download spending data series.
Review data sources.
Masthead
ukpublicspending.co.uk was designed and executed by:
Christopher Chantrill.
Report bugs here.
Budget News
Budget 2012: 50p tax rate scrapped and allowance raised
Personal allowance now close to £10,000.
Autumn Statement 2011
Chancellor George Osborne introduces six more years of pain.
Budget 2011: George Osborne set for 8bn pound windfall
Treasury revenue up, so no spending cuts in Budget 2011
> archive