
|
Total UK Government Spending
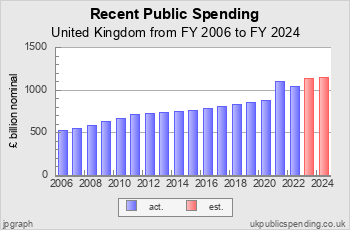
Headline central, local, and total UK public spending.
| |||||||||||||||||||||||||
Total Spending Pie Chart for FY 2026
We have central government spending data going back to 1692. Local government spending goes back to 1868.
| ||||||||||||||||||||||||||||||||||||||||||||||||||||
Spending data is updated every July from HM Treasury’s PESA report.
UK Public Spending
UK public spending includes both central government and local authority spending.
Last year, FY 2025, total public spending was £1,244.9 billion.
This year, FY 2026, total public spending is budgeted at £1,323.8 billion.
UK Deficits

The “current budget deficit” is the difference between current spending and the sum of current receipts and depreciation.
Last year, FY 2025, the deficit was £76.1 billion.
This year, FY 2026, the deficit is budgeted at £50.9 billion.
UK Public Debt

The UK National Debt is the “public sector net debt” published by ONS.
Last year, FY 2025, the national debt was £2.8139 trillion.
This year, FY 2026, the national debt is budgeted at £2.8972 trillion.
UK Defence Spending

UK defence spending here includes defence, foreign affairs, and foreign aid.
Last year, FY 2025, total defence spending was £71.4 billion.
This year, FY 2026, total defence spending is budgeted at £73.6 billion.
UK Education Spending

Last year, FY 2025, total education spending was £118.7 billion.
This year, FY 2026, total education spending is budgeted at £120.8 billion.
Spending Data Sources
Expenditure data since 1983 comes from HM Treasury’s Public Expenditure Statistical Analysis reports.
Detailed table of spending data sources here.
Gross Domestic Product data comes from measuringworth.com.
Central government spending data begins in 1692.
Local authority spending data begins in 1868.
Site Search
Data Sources for 2026:
GDP: OBR EFO supp. economy tables
Revenue: OBR March 2018 Economic and fiscal outlook – charts and tables: fiscal
Debt: OBR Public Finances Databank
> revenue data sources for other years
On April 23, 2026 the Office for National Statistics (ONS) published its annual Public Sector Finances report. On April 30, 2026 we updated ukpublicrevenue.co.uk with the new public finance data.
| £ billion | 2025-26 forecast | 2025-26 actual |
| Central Government | £1,071.9 | £1,136.9 |
| Local Authorities | £69.1 | £70.1 |
| Total UK Revenue | £1,141.0 | £1,207.0 |
Revenue outturn data comes from the Office for National Statistics' March 2026 Public Sector Finances report using a spreadsheet file pusf.csv labeled "Public sector finances time series". Outturn revenue data for ukpublicrevenue.co.uk now extends from 1692 to 2025-26.
Quick Links
Get spending chart.
Download spending table.
Download spending data series.
Review data sources.
Blog
Masthead
ukpublicspending.co.uk was designed and executed by:
Christopher Chantrill.
Report bugs here.